The ITAMOS project

INTRODUCTION:

  • Photodissociation Regions
  • Escape Probability
  • Radiative Transfer

3D-PDR:

  • The 3D-PDR code
  • Gallery
  • Getting started
  • The makefile
  • The params.dat
  • The species_[network].d
  • Constructing Initial Conditions
  • Understanding the outputs
  • Convert to hdf5
  • Examples
  • Heating Processes
  • Escape Probability and Line Cooling
  • Dust Temperature Treatment
  • H2 Formation Treatment
  • Reaction Rate Calculations
  • Gas Temperature Update
  • Shielding Functions
  • Level Population Solver

RAYTHEIA:

  • The RAYTHEIA algorithm

RT-tool:

  • The RT-tool Algorithm
  • Comparison with RADEX

RT-synth:

  • The RT-synth Algorithm
  • The Makefile
  • The paramsRTsynth.dat
  • Running RT-synth
  • The vel2fits.py
  • Gallery
The ITAMOS project
  • Gallery
  • View page source

Gallery

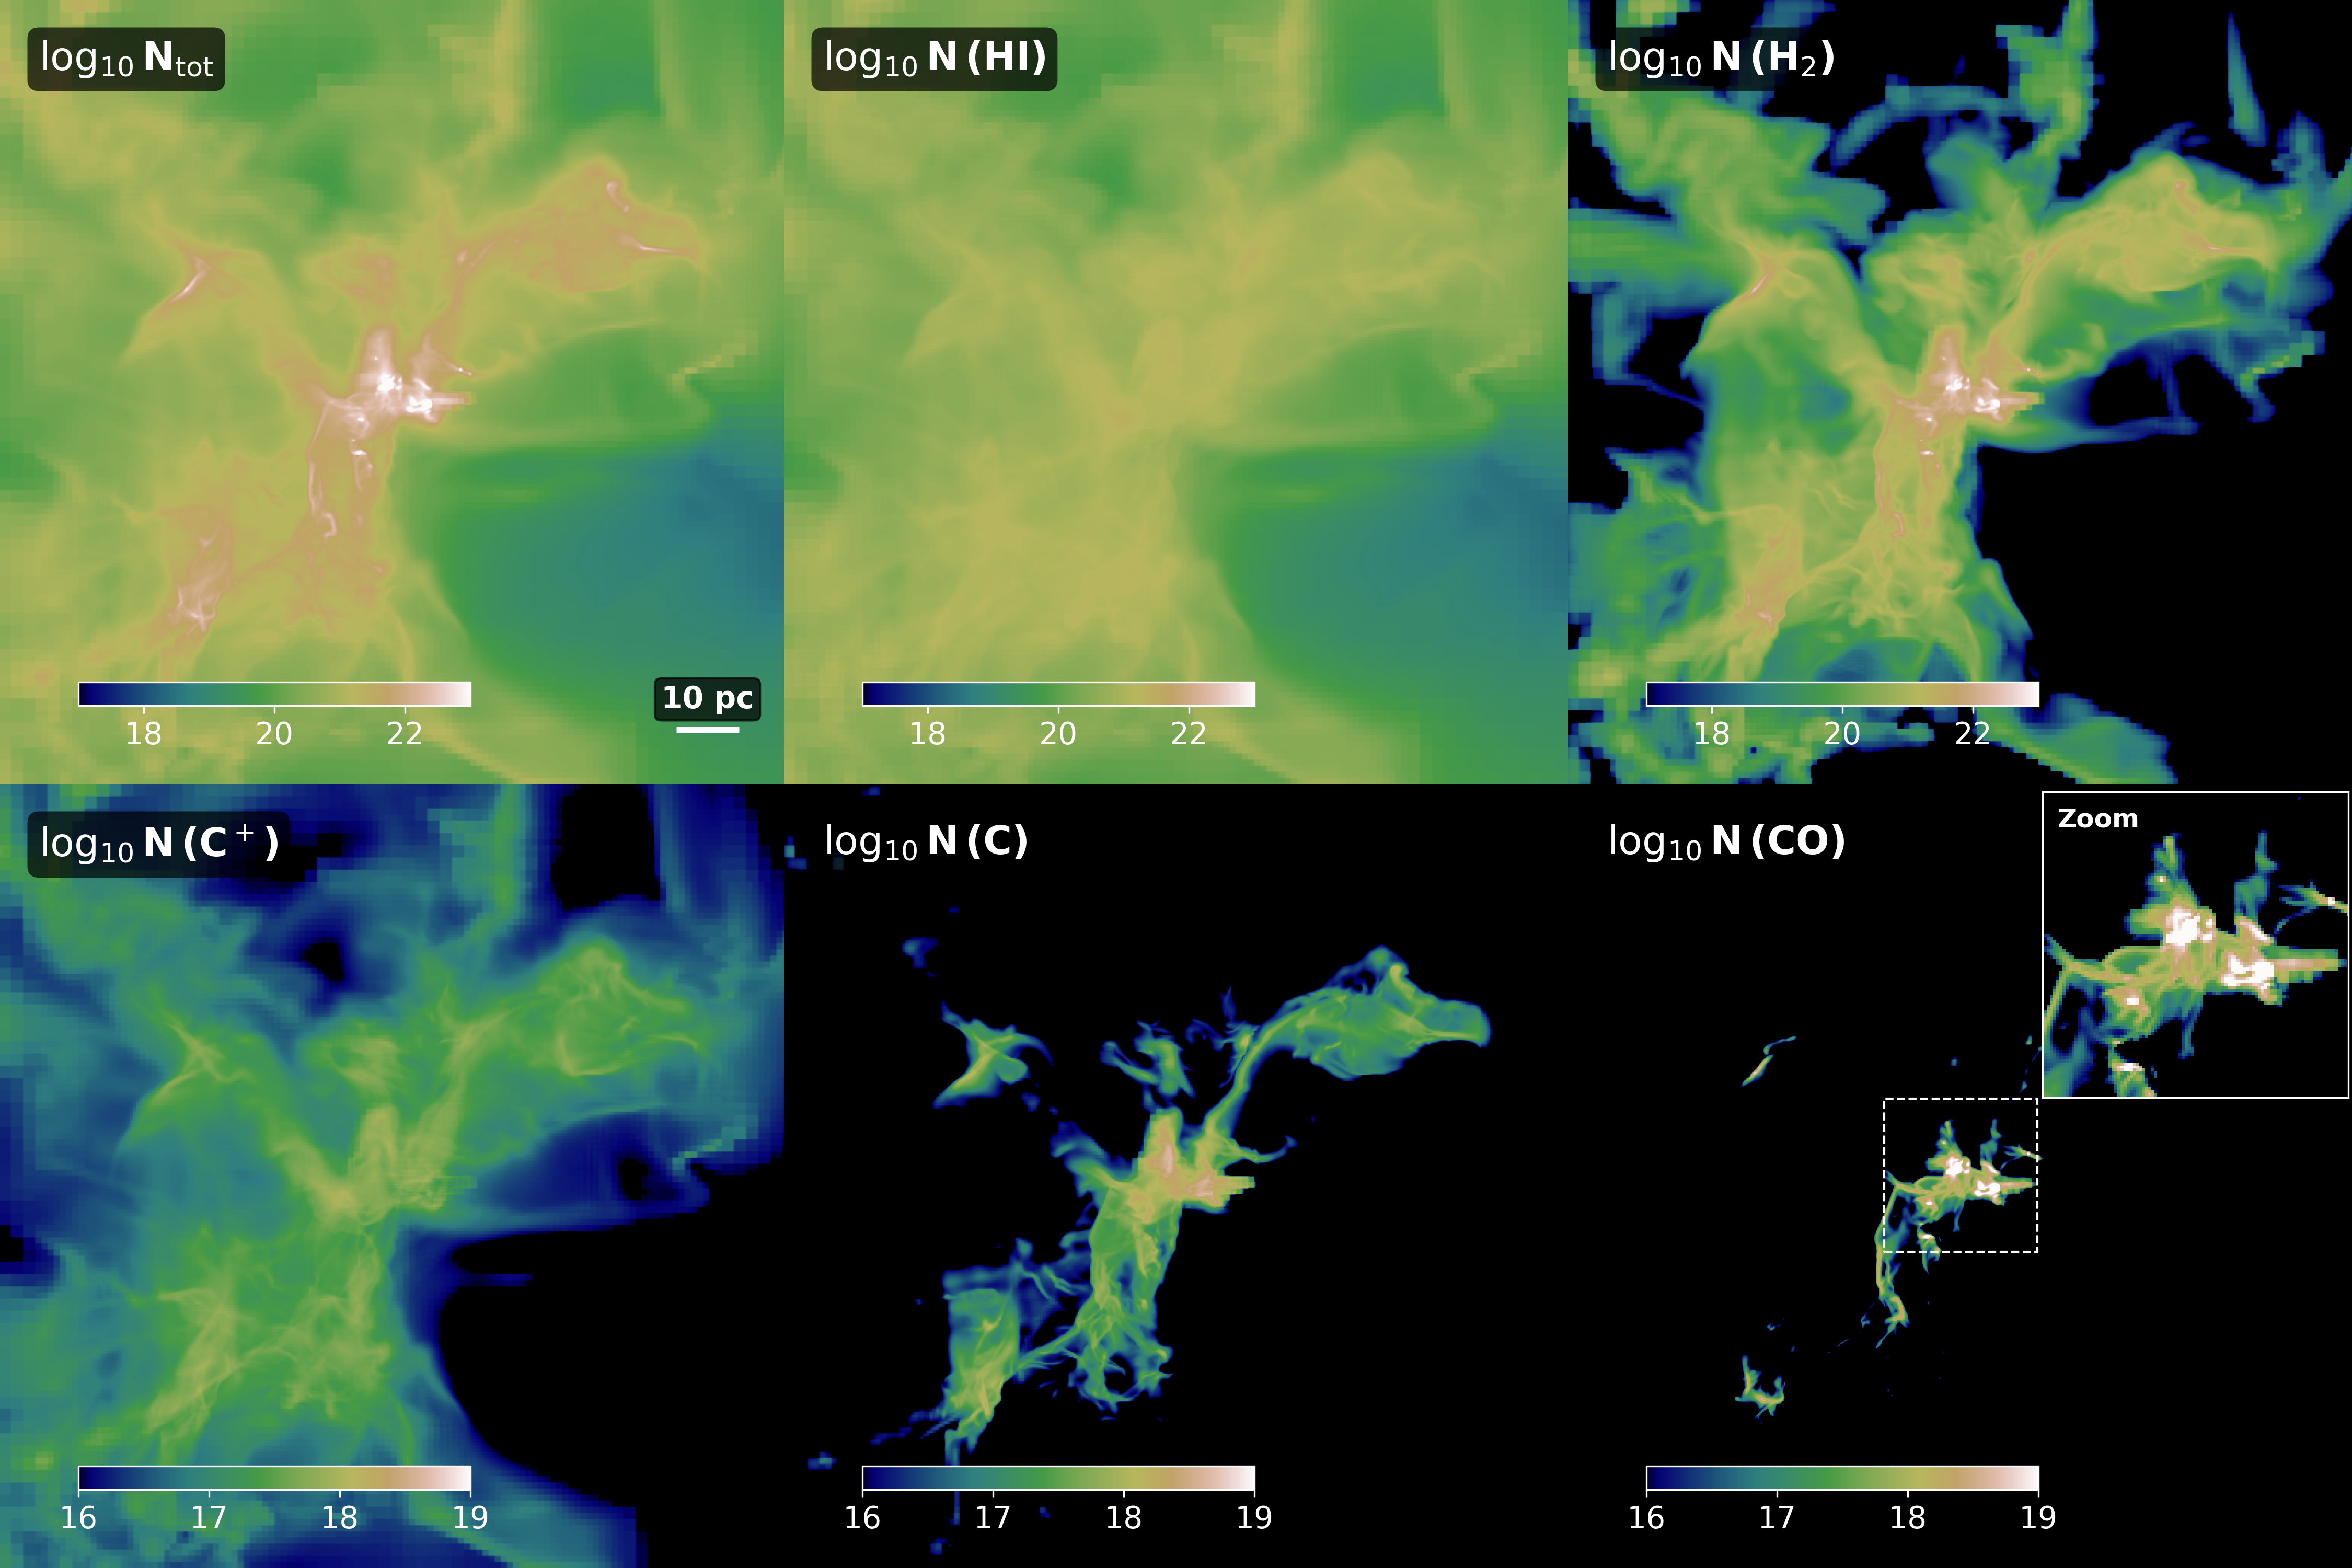
Column density maps of a star-forming region. The snapshot is taken from the SILCC-Zoom project (Seifried et al., 2017) and it is modelled at a resolution of \(512^3\) using the MPI version of 3D-PDR. This is the highest resolution 3D model of PDRs in the field.

Top left shows the column density of the total H-nucleus number density. The HI and H2 column densities are shown in the second and third paneil of the top row. Bottom row shows the column densities of the carbon cycle (C+, C, CO from left-to-right). The inset in the bottom right panel shows a close-up of the star-forming region.

Column density maps of a star-forming region
Previous Next

© Copyright 2025, Thomas G. Bisbas.

Built with Sphinx using a theme provided by Read the Docs.